
Introduction to the Psychrometric Chart
The psychrometric chart is an essential tool for engineers, HVAC professionals, and environmental scientists. This graphical diagram provides a visual representation of the thermodynamic properties of air, enabling experts to analyze and manipulate variables like temperature, humidity, and energy content. By mastering this chart, professionals can optimize heating, ventilation, and air conditioning (HVAC) systems, improve indoor air quality, and enhance energy efficiency.

Psychrometric Chart in Celsius
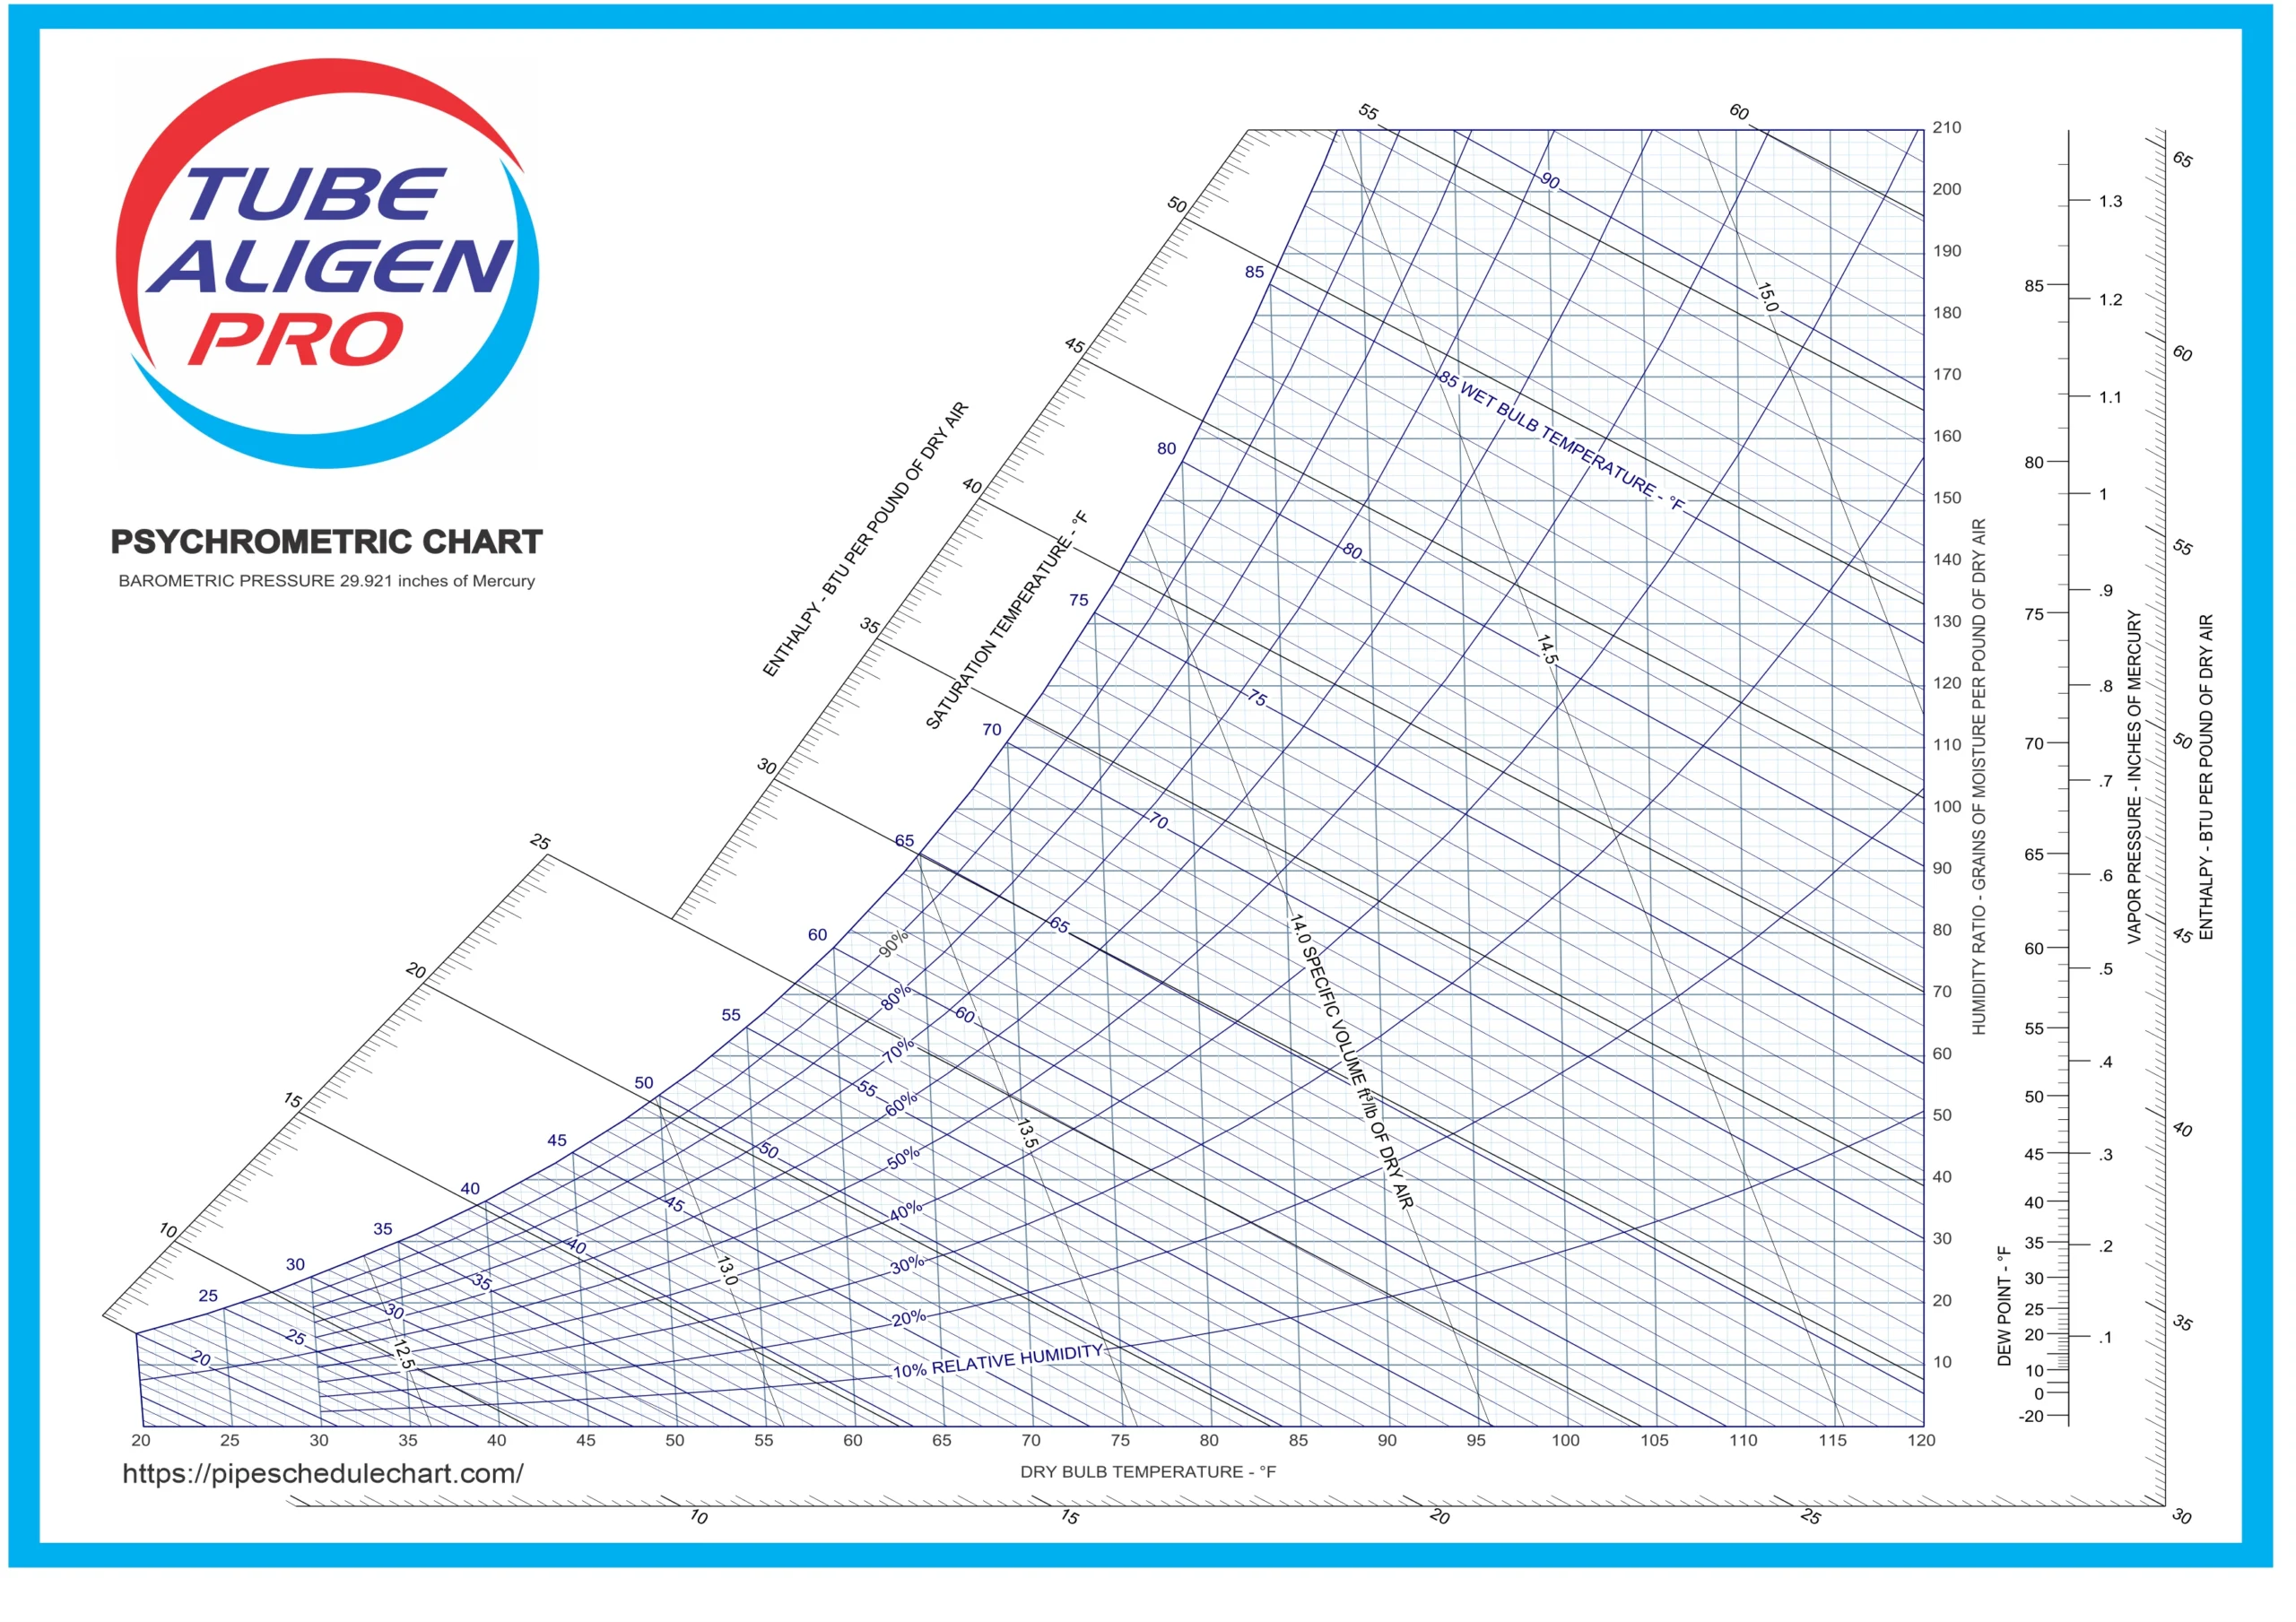
Psychrometric Chart in Fahrenheit
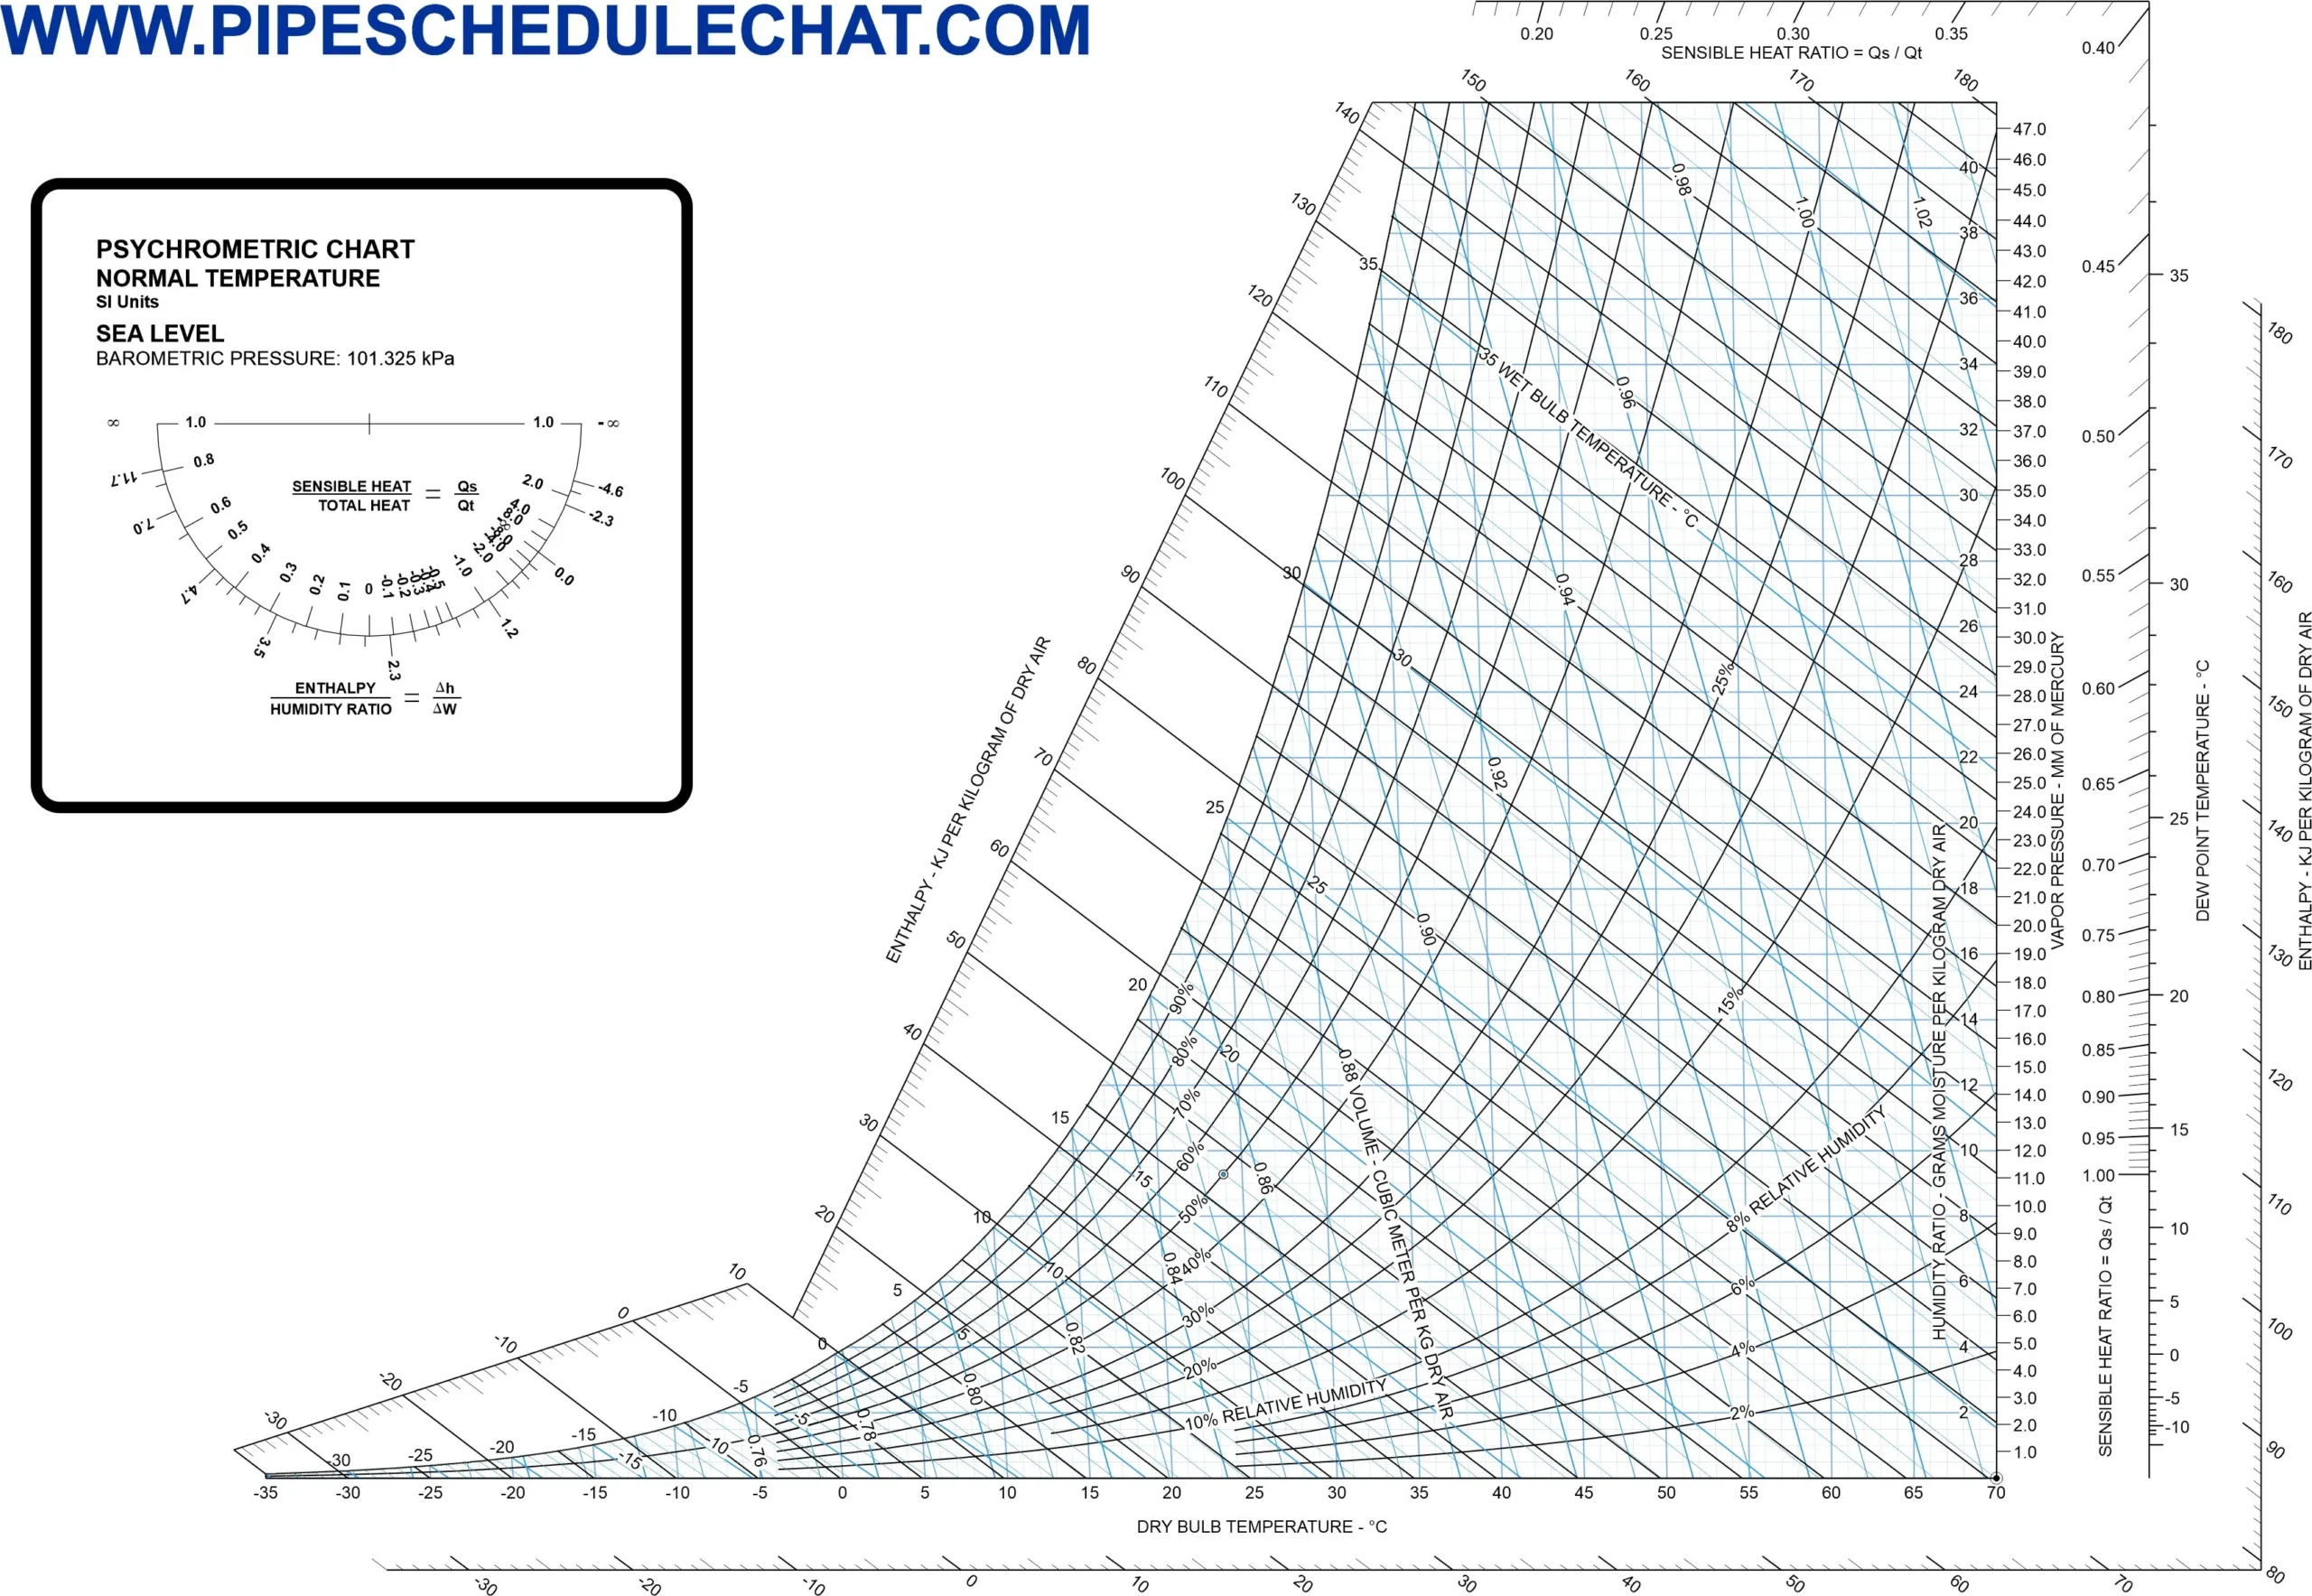
Psychrometric Chart available for immediate download in PDF format. This resource is designed to be highly versatile, featuring both Fahrenheit (℉) and Celsius (℃) scales. Whether you are working in a region that follows the Imperial system (such as the United States) or the Metric system (commonly used in the UK, Europe, and globally),
POPULAR ENGINEERING CHARTS & CALCULATORS

What Is a Psychrometric Chart?
Definition and Historical Context
A psychrometric chart is a graphical tool that illustrates the relationships between air temperature, moisture content, and energy. Developed in the early 20th century, it emerged alongside advancements in air conditioning and industrial process control. Today, it remains a cornerstone of HVAC design, agriculture, and meteorology.
This measures the volume occupied by a unit mass of air, affecting fan and ductwork design. Pipe schedule charts, which define pipe dimensions and pressure capacities, are similarly critical for HVAC plumbing systems to ensure efficient fluid transport alongside air handling.
Basic Structure of the Chart
The chart plots key air properties on two axes:
X-axis: Dry bulb temperature (°C or °F).
Y-axis: Humidity ratio (grams of moisture per kilogram of dry air).
Curved lines represent relative humidity, while diagonal lines denote enthalpy and wet-bulb temperature.
Key Components of a Psychrometric Chart
To decode the chart, understanding its core elements is critical.
Dry Bulb Temperature (DBT)
What Does It Measure?
Dry bulb temperature refers to ambient air temperature measured by a standard thermometer. It’s the starting point for analyzing air conditions.
Wet Bulb Temperature (WBT)
The Role of Evaporation
Wet bulb temperature accounts for cooling effects from evaporation. It’s measured by a thermometer wrapped in a wet cloth, reflecting air’s potential to hold moisture.
Humidity Ratio (HR)
Moisture Content Metric
Also called mixing ratio, this quantifies water vapor in air (g/kg). It’s critical for calculating dehumidification needs.
Relative Humidity (RH)
Saturation Levels
RH expresses moisture in air as a percentage of its maximum capacity at a given temperature. High RH reduces evaporative cooling efficiency.
Enthalpy (h)
Total Heat Energy
Enthalpy combines sensible and latent heat, guiding HVAC load calculations.
Specific Volume (v)
Air Density Indicator
This measures the volume occupied by a unit mass of air, affecting fan and ductwork design.
How to Read a Psychrometric Chart: A Step-by-Step Guide
Step 1 – Locate Dry Bulb Temperature
Find the vertical line matching your air’s DBT on the x-axis.
Step 2 – Identify Humidity Ratio
Trace horizontal lines from the y-axis to intersect the DBT line.
Step 3 – Determine Relative Humidity
Follow the curved RH lines to estimate moisture saturation.
Step 4 – Calculate Enthalpy and WBT
Use diagonal lines to derive total heat content and wet bulb temperature.
Practical Example
Problem: Air at 25°C DBT and 50% RH. Find WBT and humidity ratio.
Solution: Intersect 25°C with the 50% RH curve. Read WBT (≈19°C) and HR (≈10 g/kg).
Applications of the Psychrometric Chart
HVAC System Design
Optimizing Thermal Comfort
Engineers use the chart to balance temperature and humidity for occupant comfort, adhering to ASHRAE standards.
Industrial Processes
Controlling Manufacturing Environments
Food processing and pharmaceuticals rely on precise humidity control to prevent spoilage.
Agricultural Storage
Preserving Crop Quality
The chart helps design storage systems that minimize mold growth in grains.
Indoor Air Quality (IAQ) Management
Mitigating Health Risks
By managing dew point temperatures, professionals prevent condensation and microbial growth.
Benefits of Using a Psychrometric Chart
Energy Efficiency in HVAC Systems
The chart identifies optimal setpoints, reducing overcooling/reheating and lowering energy costs.
Error Reduction in Calculations
Visualizing data minimizes manual computation errors in load estimates.
Enhanced Problem-Solving Speed
Professionals diagnose air handling issues faster by plotting real-time data.
Advanced Psychrometric Concepts
Adiabatic Saturation
Evaporative Cooling Principle
This process cools air by adding moisture without heat exchange, common in desert coolers.
Mixing of Airstreams
Balancing Ventilation Air
The chart solves mixed air conditions when combining outdoor and recirculated air.
Sensible vs. Latent Heat
Differentiating Heat Types
Sensible heat changes temperature, while latent heat alters moisture state.
A psychrometric chart maps the relationships between air temperature, humidity, enthalpy, and other properties. Developed in the early 20th century by Willis Carrier, the “father of modern air conditioning,” it remains a cornerstone of HVAC design and environmental analysis.
Key Components Explained
1. Dry-Bulb Temperature (DBT):
Horizontal axis, measured by a standard thermometer.
Example: 75°F DBT indicates the air’s sensible heat level.
2. Wet-Bulb Temperature (WBT):
Diagonal lines; measured by a thermometer wrapped in a wet cloth.
Reflects evaporative cooling potential (e.g., 65°F WBT at 75°F DBT).
3. Relative Humidity (RH):
Curved lines from 0% to 100% (saturation curve).
At 50% RH, air holds half its maximum moisture capacity.
4. Humidity Ratio:
Vertical axis, in grains per pound (IP) or grams per kilogram (SI).
Directly indicates moisture content (e.g., 80 grains/lb at 75°F DBT).
5. Enthalpy:
Diagonal lines representing total heat energy (sensible + latent) in BTU/lb or kJ/kg.
6. Dew Point (DP):
Temperature where air becomes saturated (100% RH).
Critical for preventing condensation in buildings.
Historical Insight:
Early charts were hand-drawn, but modern versions like the **ASHRAE psychrometric chart** standardize calculations across industries.
2. Key Applications Across Industries**
HVAC System
Load Calculations: Determine heating/cooling needs by plotting indoor/outdoor air conditions.
Duct Design: Optimize airflow using specific volume (ft³/lb) to size ducts.
Case Study: An HVAC engineer uses the chart to design a system for a 10,000 sq. ft. office, ensuring 75°F DBT and 50% RH.
Agriculture
Greenhouse Management: Balance humidity and temperature for crop growth.
Livestock Ventilation: Prevent respiratory issues by maintaining 60–70% RH in barns.
Industrial Processes
Pharmaceuticals: Control humidity during drug manufacturing to ensure stability.
Food Drying: Use enthalpy lines to optimize energy use in dehydrators.
3. Printable Psychrometric Charts and PDF Resources
Printable psychrometric charts in PDF format are ideal for fieldwork or quick reference. Key sources include:
4. Psychrometric Chart Calculators: Online Tools
Example Problem:
Air at 80°F DBT and 60% RH – Find WBT, DP, and Enthalpy.
1. Locate DBT: Start at 80°F on the horizontal axis.
2. Follow RH Curve: Move up to the 60% RH curve.
3. Find WBT: Diagonal wet-bulb lines intersect at ~67°F.
4. Dew Point: Move horizontally left to the saturation curve (~64°F).
5. Enthalpy: Follow diagonal enthalpy lines to ~31 BTU/lb.
Common Pitfalls:
– Confusing WBT and DP (WBT > DP).
– Misaligning humidity ratio scales (check units).
6. ASHRAE Psychrometric Chart Features**
8. Common Mistakes and Pro Tips**
Mistakes:
Ignoring altitude corrections (critical for Denver vs. Miami).
-Overlooking latent heat in cooling load calculations.
Tips:
Use highlighters on printed charts for key lines.
Cross-validate digital results with manual plots.
FAQ
Conclusion
The psychrometric chart is indispensable for analyzing air-water vapor mixtures. Its applications span HVAC design, industrial quality control, and sustainable agriculture. By mastering this tool, professionals enhance system efficiency, ensure occupant comfort, and reduce environmental impact. As technology evolves, digital psychrometric calculators integrate this timeless chart into modern workflows, proving its enduring relevance.


I have been checking out a few of your posts and it’s nice stuff. I will surely bookmark your site.
I enjoy your work, regards for all the interesting articles.
It’s hard to find knowledgeable people on this topic, but you sound like you know what you’re talking about! Thanks
You have brought up a very good points, regards for the post.
Good – I should definitely pronounce, impressed with your website. I had no trouble navigating through all tabs as well as related info ended up being truly simple to do to access. I recently found what I hoped for before you know it in the least. Reasonably unusual. Is likely to appreciate it for those who add forums or anything, website theme . a tones way for your customer to communicate. Nice task..
You have brought up a very good details , regards for the post.
Excellent web site. Lots of useful information here. I?¦m sending it to several pals ans additionally sharing in delicious. And certainly, thanks in your sweat!
Saved as a favorite, I really like your blog!
Hey very cool website!! Guy .. Excellent .. Wonderful .. I’ll bookmark your web site and take the feeds additionally…I am satisfied to find so many useful info right here within the submit, we want work out more strategies on this regard, thank you for sharing. . . . . .
Thank you for any other informative web site. Where else may just I am getting that type of info written in such a perfect way? I’ve a venture that I’m just now working on, and I have been on the look out for such info.
Very good written post. It will be valuable to anybody who usess it, as well as myself. Keep up the good work – for sure i will check out more posts.
Appreciate it for helping out, excellent information.
Very interesting subject , thankyou for posting.
Hi, just required you to know I he added your site to my Google bookmarks due to your layout. But seriously, I believe your internet site has 1 in the freshest theme I??ve came across. It extremely helps make reading your blog significantly easier.
I am constantly thought about this, regards for putting up.
Good clarity
I like this weblog very much, Its a real nice post to read and receive info .
Some really great blog posts on this website, thanks for contribution. “Be absolutely determined to enjoy what you do.” by Sarah Knowles Bolton.
Very good written post. It will be helpful to anybody who usess it, as well as me. Keep up the good work – can’r wait to read more posts.
Thanks for any other informative web site. The place else could I get that kind of info written in such a perfect way? I have a challenge that I’m simply now working on, and I’ve been on the look out for such info.
Hi! I could have sworn I’ve been to this site before but after browsing through some of the post I realized it’s new to me. Anyways, I’m definitely delighted I found it and I’ll be bookmarking and checking back frequently!
This really answered my problem, thank you!
I truly appreciate this post. I have been looking everywhere for this! Thank goodness I found it on Bing. You’ve made my day! Thanks again!
I am impressed with this website , really I am a big fan .
Good post. I be taught one thing more difficult on different blogs everyday. It is going to always be stimulating to learn content material from different writers and observe just a little something from their store. I’d want to use some with the content on my weblog whether or not you don’t mind. Natually I’ll provide you with a link in your internet blog. Thanks for sharing.
I have been browsing online more than 3 hours as of late, but I by no means found any attention-grabbing article like yours. It’s pretty worth sufficient for me. In my opinion, if all site owners and bloggers made good content material as you probably did, the web might be a lot more helpful than ever before.
Howdy very nice blog!! Guy .. Beautiful .. Superb .. I will bookmark your blog and take the feeds also?KI am satisfied to search out so many useful info here within the post, we’d like develop extra strategies in this regard, thank you for sharing. . . . . .